Foxorox AI Market Forecast – Aptiv and Ciena – 2026-07-18

AI-assisted market analysis combining predictive signals, current financial results and recent industry context. Data checked as of 18 July 2026.

Aptiv PLC (NYSE: APTV)

AI gap signal 37.11%
AI candle signal 70.09% – bullish / white candle
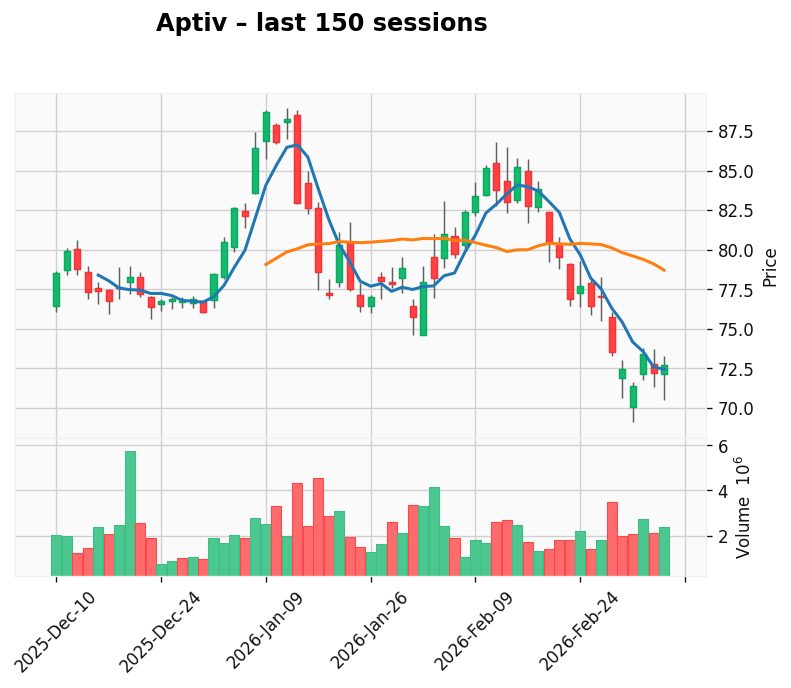
Market snapshot Share price around $57.47; market capitalization approximately $12.3B
Aptiv market chart NYSE:APTV
Foxorox predictive chart
Aptiv Foxorox predictive chart

Aptiv – a cleaner technology story after the Versigent separation

Aptiv is moving through an important portfolio transition. On 1 April 2026, the company completed the spin-off of its Electrical Distribution Systems business as Versigent. Beginning with the second quarter, Aptiv’s reported results are expected to represent a more focused company built around intelligent systems, advanced software, sensing, compute, connectivity and engineered components. Last LUCID turmoil may trigge some short selling gonected to automtive industry but one banckrupcy can not trigger so deep fall and cut of all sources of revenues.

This separation changes how the stock should be analyzed. The former Aptiv combined relatively labor-intensive electrical architecture operations with higher-value software, advanced driver-assistance systems and electronic components. The new structure should provide a clearer view of the margins and cash-generation potential of the remaining technology portfolio, although it also removes part of the scale and revenue stability associated with the separated business.

Main thesis: The Foxorox model produces a bullish candle probability of 70.09%, but the fundamental case depends less on one trading session and more on whether post-spin Aptiv can deliver the higher margins and stronger free cash flow implied by management’s 2026 guidance. The stock may offer value if the market continues to price it like a traditional auto supplier rather than a focused mobility-technology company.

Latest quarterly results

For the first quarter of 2026, Aptiv reported revenue of $5.1 billion, up 5% year over year on a reported basis and 1% after adjusting for foreign exchange and commodity movements. GAAP net income was $189 million, adjusted EBITDA was $752 million and adjusted diluted EPS was $1.71.

Profitability remained under pressure. Adjusted EBITDA margin declined to 14.8% from 15.7% a year earlier, while adjusted operating margin fell to 11.0% from 11.9%. Management attributed the pressure mainly to commodity costs and foreign-exchange effects, partially offset by higher volumes.

Q1 2026 metric Result Year-on-year context Interpretation
Revenue $5.1B +5% reported; +1% adjusted Moderate top-line growth despite weak conditions in parts of the global auto market.
Adjusted EBITDA $752M Down slightly from $758M Stable absolute earnings, but margin compression remains a concern.
Adjusted EBITDA margin 14.8% 15.7% in Q1 2025 Post-spin margin expansion must offset cost and currency pressure.
Adjusted EPS $1.71 $1.69 in Q1 2025 Resilient earnings despite softer operating leverage.
Free cash flow -$362M $76M in Q1 2025 Seasonality and separation effects make cash conversion a key monitoring point.

2026 guidance for the new Aptiv

Management’s outlook for the post-spin company implies full-year 2026 revenue of $12.8–13.2 billion, adjusted EBITDA of $2.36–2.48 billion and adjusted EPS of $5.70–6.10. The midpoint suggests an adjusted EBITDA margin of approximately 18.6%, materially above the consolidated margin reported in the first quarter.

Guidance item Q2 2026 Full-year 2026 Foxorox interpretation
Revenue $3.2–3.4B $12.8–13.2B The smaller revenue base reflects the Versigent separation, not an underlying collapse.
Adjusted EBITDA $555–605M $2.36–2.48B Management expects a significantly richer margin profile after the spin-off.
Adjusted EBITDA margin 17.6% midpoint 18.6% midpoint Margin delivery is the most important test of the new corporate structure.
Adjusted EPS $1.30–1.50 $5.70–6.10 Provides a basis for a relatively modest earnings multiple at the current share price.
Free cash flow Not separately guided $650–850M Cash conversion should become a major rerating catalyst if guidance is achieved.

Why the market may be cautious

Aptiv remains exposed to global vehicle production, pricing pressure from automakers, foreign exchange, raw-material costs and continued weakness in China and Europe. First-quarter adjusted revenue declined 7% in EMEA and 2% in China, showing that the company’s technology content does not completely isolate it from regional auto cycles.

The separation also introduces execution risk. Investors need evidence that the remaining business can generate the targeted margin and free-cash-flow profile without the scale benefits of the former distribution-systems segment.

Bull, base and bear case

Scenario Assumption Financial implication Investment interpretation
Bull case Post-spin margins reach or exceed guidance, intelligent systems accelerate and free cash flow approaches the top of the range. Higher quality of earnings and stronger cash conversion. The market begins valuing Aptiv as a focused technology platform rather than a low-multiple auto supplier.
Base case Revenue remains stable and margins improve gradually, but global auto demand stays uneven. Adjusted EPS lands near the middle of guidance. Moderate rerating potential with continued volatility.
Bear case Auto production weakens, China remains soft and cost pressure prevents margin expansion. Free cash flow and EPS fall below guidance. The spin-off fails to produce the expected valuation improvement.

Foxorox conclusion on Aptiv

The quantitative signal is bullish, but the more important investment event is Aptiv’s corporate reset. At a share price near $57.47 and a trailing P/E close to 8x, the stock appears inexpensive relative to many technology companies. That discount reflects real automotive and execution risk, but it also creates upside if management delivers the targeted 18%+ adjusted EBITDA margin and restores free-cash-flow generation.
Ciena Corporation (NYSE: CIEN)

AI gap signal 68.47%
AI candle signal 69.43% – bullish / white candle
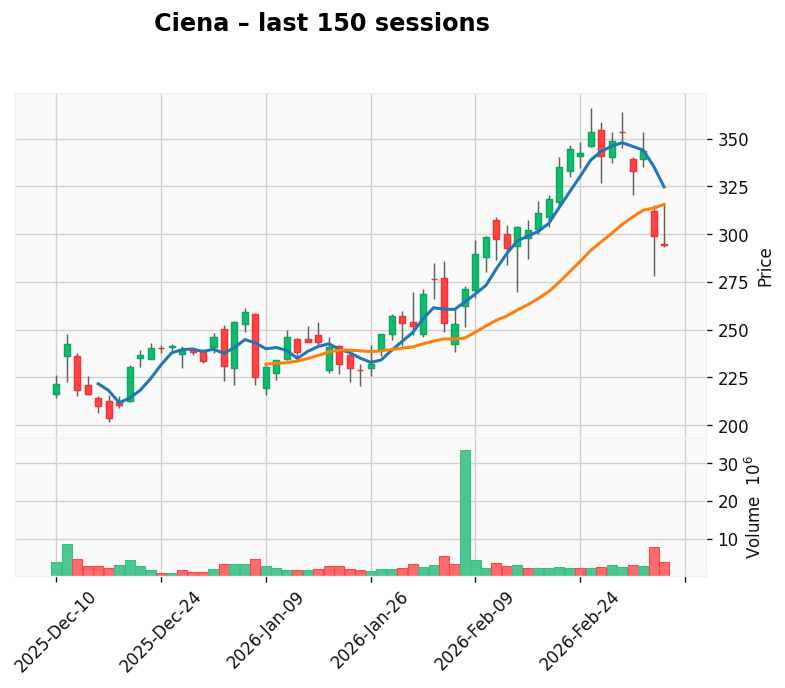
Market snapshot Share price around $374.41; market capitalization approximately $54.8B
Ciena market chart NYSE:CIEN
Foxorox predictive chart
Ciena Foxorox predictive chart

Ciena – AI infrastructure is becoming an optical-networking cycle

Ciena is one of the most direct public-market beneficiaries of the rapid increase in traffic between and around data centers. AI clusters require not only processors and memory, but also high-capacity, low-latency optical connectivity. As model sizes and cluster architectures expand, the network increasingly becomes a system-level bottleneck.

The company supplies optical systems, routing platforms, software and network services used by telecom operators, cloud providers and large data-center customers. This places Ciena at the intersection of traditional carrier investment and the newer AI-driven demand for data-center interconnect and high-speed optical transport.

Main thesis: Ciena’s revenue growth and margin expansion confirm that AI infrastructure spending is reaching the optical layer. The Foxorox model remains bullish, but the stock’s elevated valuation means that strong results alone may not be enough. The company must continue beating already aggressive expectations.

Fiscal Q2 2026 results

Ciena reported fiscal second-quarter revenue of $1.57 billion, up 39.5% year over year. Adjusted EPS rose to $1.64 from $0.42, an increase of approximately 290%. GAAP gross margin improved to 44.0%, while adjusted gross margin reached 44.9%.

Operating leverage was significant. GAAP operating margin increased to 15.1% from 2.9%, and adjusted operating margin rose to 19.5% from 8.2%. Adjusted EBITDA increased to $341.8 million from $116.7 million.

FQ2 2026 metric Result Year-on-year change Interpretation
Revenue $1.571B +39.5% AI and data-center demand are producing a clear top-line acceleration.
Adjusted EPS $1.64 +290% Earnings are growing much faster than revenue because of operating leverage.
Adjusted gross margin 44.9% +3.9 percentage points Product mix and better execution are improving unit economics.
Adjusted operating margin 19.5% 8.2% a year earlier The company is approaching a substantially more profitable earnings model.
Adjusted EBITDA $341.8M +192.9% Strong proof that the revenue expansion is converting into operating profit.

Management outlook

Ciena guided fiscal third-quarter revenue to $1.625 billion plus or minus $50 million, with adjusted gross margin of approximately 45% and adjusted operating margin of 19–20%. Full-year 2026 revenue guidance was raised to $6.3 billion plus or minus $100 million, representing approximately 32% growth at the midpoint.

Guidance item FQ3 2026 FY2026 Foxorox interpretation
Revenue $1.575–1.675B $6.2–6.4B Management expects the strong demand environment to persist through the year.
Adjusted gross margin 44.5–45.5% 44.5–45.0% Implies that current margin improvement is not viewed as a one-quarter event.
Adjusted operating margin 19–20% 18.5–19.5% Continued operating leverage is central to the earnings thesis.
Revenue growth Sequential increase expected ~32% at midpoint Ciena has become one of the fastest-growing large optical-networking suppliers.

Why AI creates structural demand for Ciena

AI workloads require large volumes of data to move between training clusters, storage systems and geographically separated data centers. Copper connectivity remains important inside racks and short-distance environments, but optical transport becomes increasingly necessary as bandwidth and distance increase.

Ciena benefits through coherent optics, data-center interconnect, wide-area network upgrades and software used to manage complex network capacity. Large cloud and internet companies are therefore becoming increasingly important customers alongside traditional telecom carriers.

Why the stock can fall after strong results

Ciena’s strong results have also created a valuation problem. The stock traded around $374.41 on 17 July 2026 and the trailing P/E was above 120x based on the available market snapshot. Such a multiple can compress rapidly if growth slows, gross margins disappoint or supply constraints limit shipments.

The market reaction to recent earnings illustrates this risk. Even after Ciena exceeded quarterly revenue and EPS expectations, the shares fell sharply because investors had already priced in exceptional AI-driven growth and wanted a stronger forward outlook.

Key risks

Risk Potential impact
High valuation Even strong earnings may not protect the stock from multiple compression.
Customer concentration Changes in spending by a small number of cloud or telecom customers could materially affect orders.
Supply-chain constraints Component shortages can limit the company’s ability to convert demand into revenue.
AI capex normalization A slowdown in data-center construction would reduce the urgency of network upgrades.
Technology substitution Changes in optical architecture, pluggables or co-packaged optics may alter competitive economics.

Bull, base and bear case

Scenario Assumption Financial implication Investment interpretation
Bull case Cloud customers accelerate optical-network spending and Ciena sustains margins near 20%. Revenue remains above guidance and EPS continues to scale faster than sales. The premium valuation remains supported by structural AI-networking growth.
Base case FY2026 guidance is achieved, but growth moderates in 2027 as comparisons become more difficult. Strong earnings with greater share-price volatility. Operational momentum remains positive, but upside becomes increasingly dependent on valuation.
Bear case AI capex slows, supply constraints persist or major customers delay orders. Revenue growth and margin expansion disappoint. A high earnings multiple produces disproportionate downside.

Foxorox conclusion on Ciena

Ciena is delivering one of the clearest examples of AI demand moving beyond chips into networking infrastructure. Fiscal Q2 results and raised full-year guidance support the fundamental thesis. However, the stock is no longer priced like a conventional telecom-equipment supplier. It is priced as a strategic AI-infrastructure growth company.

The Foxorox bullish candle probability of 69.43% is consistent with positive operating momentum, but the 68.47% gap signal should be interpreted in the context of elevated volatility and expectations. Ciena may continue outperforming if data-center optical demand remains supply-constrained, but the risk-reward is materially more valuation-sensitive than Aptiv’s.

Comparative Foxorox View

Company Primary theme Latest fundamental signal Valuation character Foxorox view
Aptiv Post-spin mobility technology and margin expansion Moderate revenue growth, ambitious post-spin margin and cash-flow targets Low earnings multiple Value and execution opportunity
Ciena AI-driven optical networking 40% revenue growth, nearly fourfold adjusted EPS growth and raised guidance High-growth premium Stronger fundamentals, but higher valuation risk

Final conclusion: The two bullish model signals represent different investment setups. Aptiv is primarily a corporate-transformation and valuation thesis. Ciena is primarily an AI-infrastructure growth thesis. Aptiv requires proof of margin and free-cash-flow improvement; Ciena requires continued earnings beats strong enough to justify a very demanding valuation.

Written and edited by Pawel Demczuk, MSc, with Foxorox AI Analyzer.

Source Appendix

Primary sources used: Aptiv Q1 2026 financial results and outlook; Ciena fiscal Q2 2026 financial results and outlook; current market data from public financial-market providers; MarketWatch, Barron's, Yahoo Finance and Investors Business Daily market commentary. Figures are rounded for readability. Predictive percentages are Foxorox model outputs supplied with the original report. This article is not financial advice.

Aptiv Q1 2026 results: Aptiv Investor Relations
Ciena FQ2 2026 results: Ciena Investor Relations
Aptiv market page: Yahoo Finance
Ciena market page: Yahoo Finance
TradingView Aptiv: TradingView
TradingView Ciena: TradingView